> For the complete documentation index, see [llms.txt](https://yasongxu.gitbook.io/container-monitor/llms.txt). Markdown versions of documentation pages are available by appending `.md` to page URLs; this page is available as [Markdown](https://yasongxu.gitbook.io/container-monitor/yi-.-kai-yuan-fang-an/di-2-zhang-prometheus/prometheus-bu-shu-fang-an.md).
# Prometheus部署方案
## 一.单独部署
* 二进制安装 各版本下载地址:
* Docker运行 运行命令:docker run --name prometheus -d -p 127.0.0.1:9090:9090 prom/prometheus 暴露服务:
## 二.在K8S中部署
如果在Kubernetes中部署Prometheus,可以使用[prometheus in kubernetes](https://github.com/giantswarm/prometheus),含exporter、grafana等组件。
安装方式:
```
kubectl apply \
--filename https://raw.githubusercontent.com/giantswarm/kubernetes-prometheus/master/manifests-all.yaml
```
卸载方式:
```
kubectl delete namespace monitoring
```
该方式为大多数用户和云厂商使用的方式,可以基于Prometheus的服务发现:在annotation中设置prometheus.io/scrape为true,就可以把K8S的所有服务都加入到监控中,但在使用的过程中会有一些问题:
* 1.如果增加了新的exporter,如nginx-exporter,需要修改prometheus配置并重启
* 2.服务本身和监控配置没有分离
* 3.监控集群多实例的状态不好管理
* 4.报警配置也包含在prometheus的配置中,监控与报警没有分离,添加规则麻烦
以上问题一般的处理方式为:在prometheus上加一个控制台,来动态配置target、报警规则,并向后端server发起修改、重启操作。同时有权限控制、日志审计、整体配置过期时间等功能。
但如果使用了Prometheus Operator,就可以将以上大多数操作抽象为k8s中的资源提交、修改,减少上层封装的工作量。
## 三.Prometheus Operator部署
Prometheus-Operator是一套为了方便整合prometheus和kubernetes的开源方案,使用Prometheus-Operator可以非常简单的在kubernetes集群中部署Prometheus服务,用户能够使用简单的声明性配置来配置和管理Prometheus实例,这些配置将响应、创建、配置和管理Prometheus监控实例。
* 官方地址:
* 目前状态:beta状态,还不够完整,但向后兼容。将成为趋势
* 前置条件:要求k8s的版本>=1.8.0(应该是因为metric api和CRD支持的限制)
Operator的核心思想是将Prometheus的部署与它监控的对象的配置分离,做到部署与监控对象的配置分离之后,就可以轻松实现动态配置。使用Operator部署了Prometheus之后就可以不用再管Prometheus Server了,以后如果要添加监控对象或者添加告警规则,只需要编写对应的ServiceMonitor和Prometheus资源就可以,不用再重启Prometheus服务,Operator会动态的观察配置的改动,并将其生成为对应的prometheus配置文件其中Operator可以部署、管理Prometheus Service
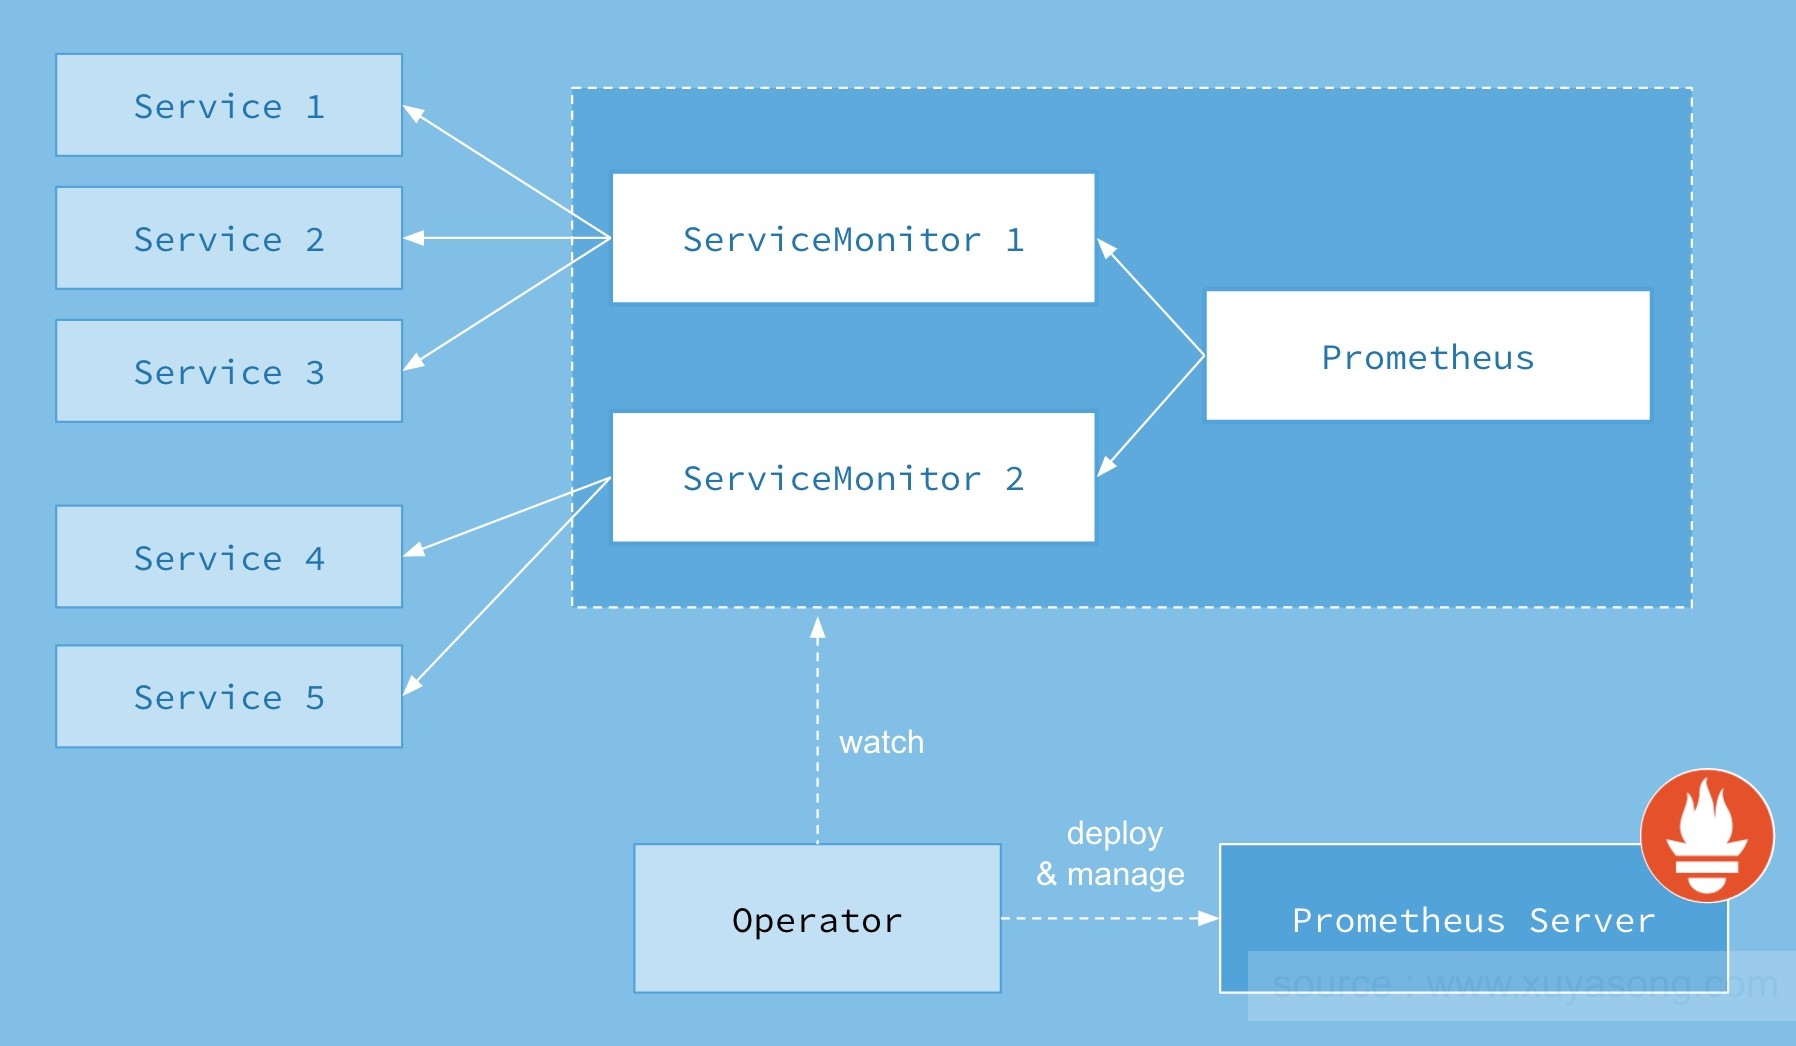
四种CRD作用如下:
* Prometheus: 由 Operator 依据一个自定义资源kind: Prometheus类型中,所描述的内容而部署的 Prometheus Server 集群,可以将这个自定义资源看作是一种特别用来管理Prometheus Server的StatefulSets资源。
* ServiceMonitor: 一个Kubernetes自定义资源(和kind: Prometheus一样是CRD),该资源描述了Prometheus Server的Target列表,Operator 会监听这个资源的变化来动态的更新Prometheus Server的Scrape targets并让prometheus server去reload配置(prometheus有对应reload的http接口/-/reload)。而该资源主要通过Selector来依据 Labels 选取对应的Service的endpoints,并让 Prometheus Server 通过 Service 进行拉取(拉)指标资料(也就是metrics信息),metrics信息要在http的url输出符合metrics格式的信息,ServiceMonitor也可以定义目标的metrics的url。
* Alertmanager:Prometheus Operator 不只是提供 Prometheus Server 管理与部署,也包含了 AlertManager,并且一样通过一个 kind: Alertmanager 自定义资源来描述信息,再由 Operator 依据描述内容部署 Alertmanager 集群。
* PrometheusRule:对于Prometheus而言,在原生的管理方式上,我们需要手动创建Prometheus的告警文件,并且通过在Prometheus配置中声明式的加载。而在Prometheus Operator模式中,告警规则也编程一个通过Kubernetes API 声明式创建的一个资源.告警规则创建成功后,通过在Prometheus中使用想servicemonitor那样用ruleSelector通过label匹配选择需要关联的PrometheusRule即可。
安装方式:
* 创建命名空间:monitoring
* 执行yaml文件:
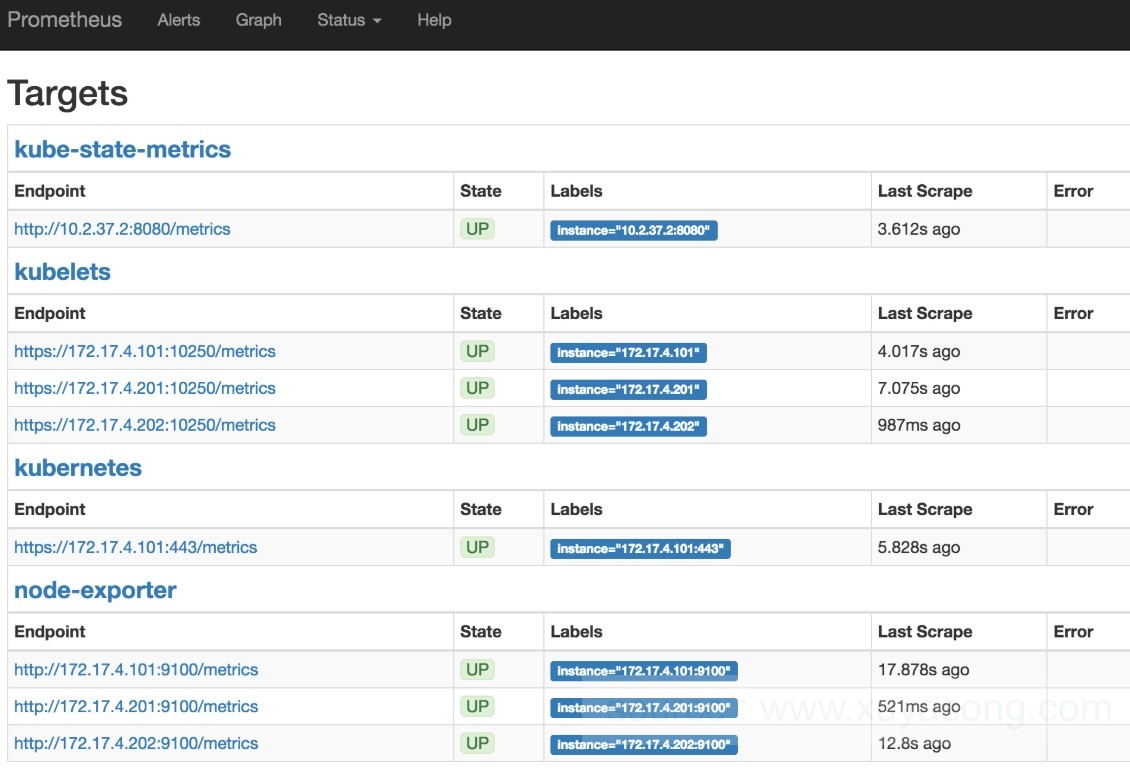
prometheus的target列表:
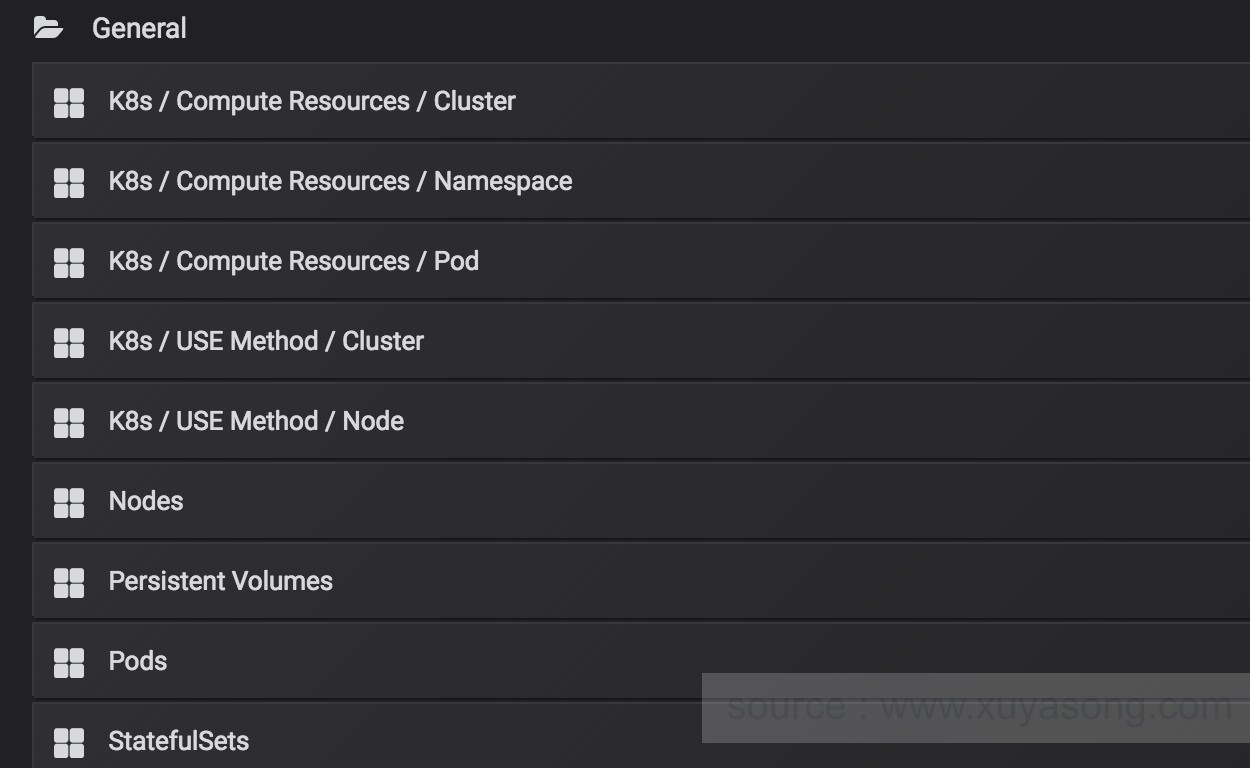
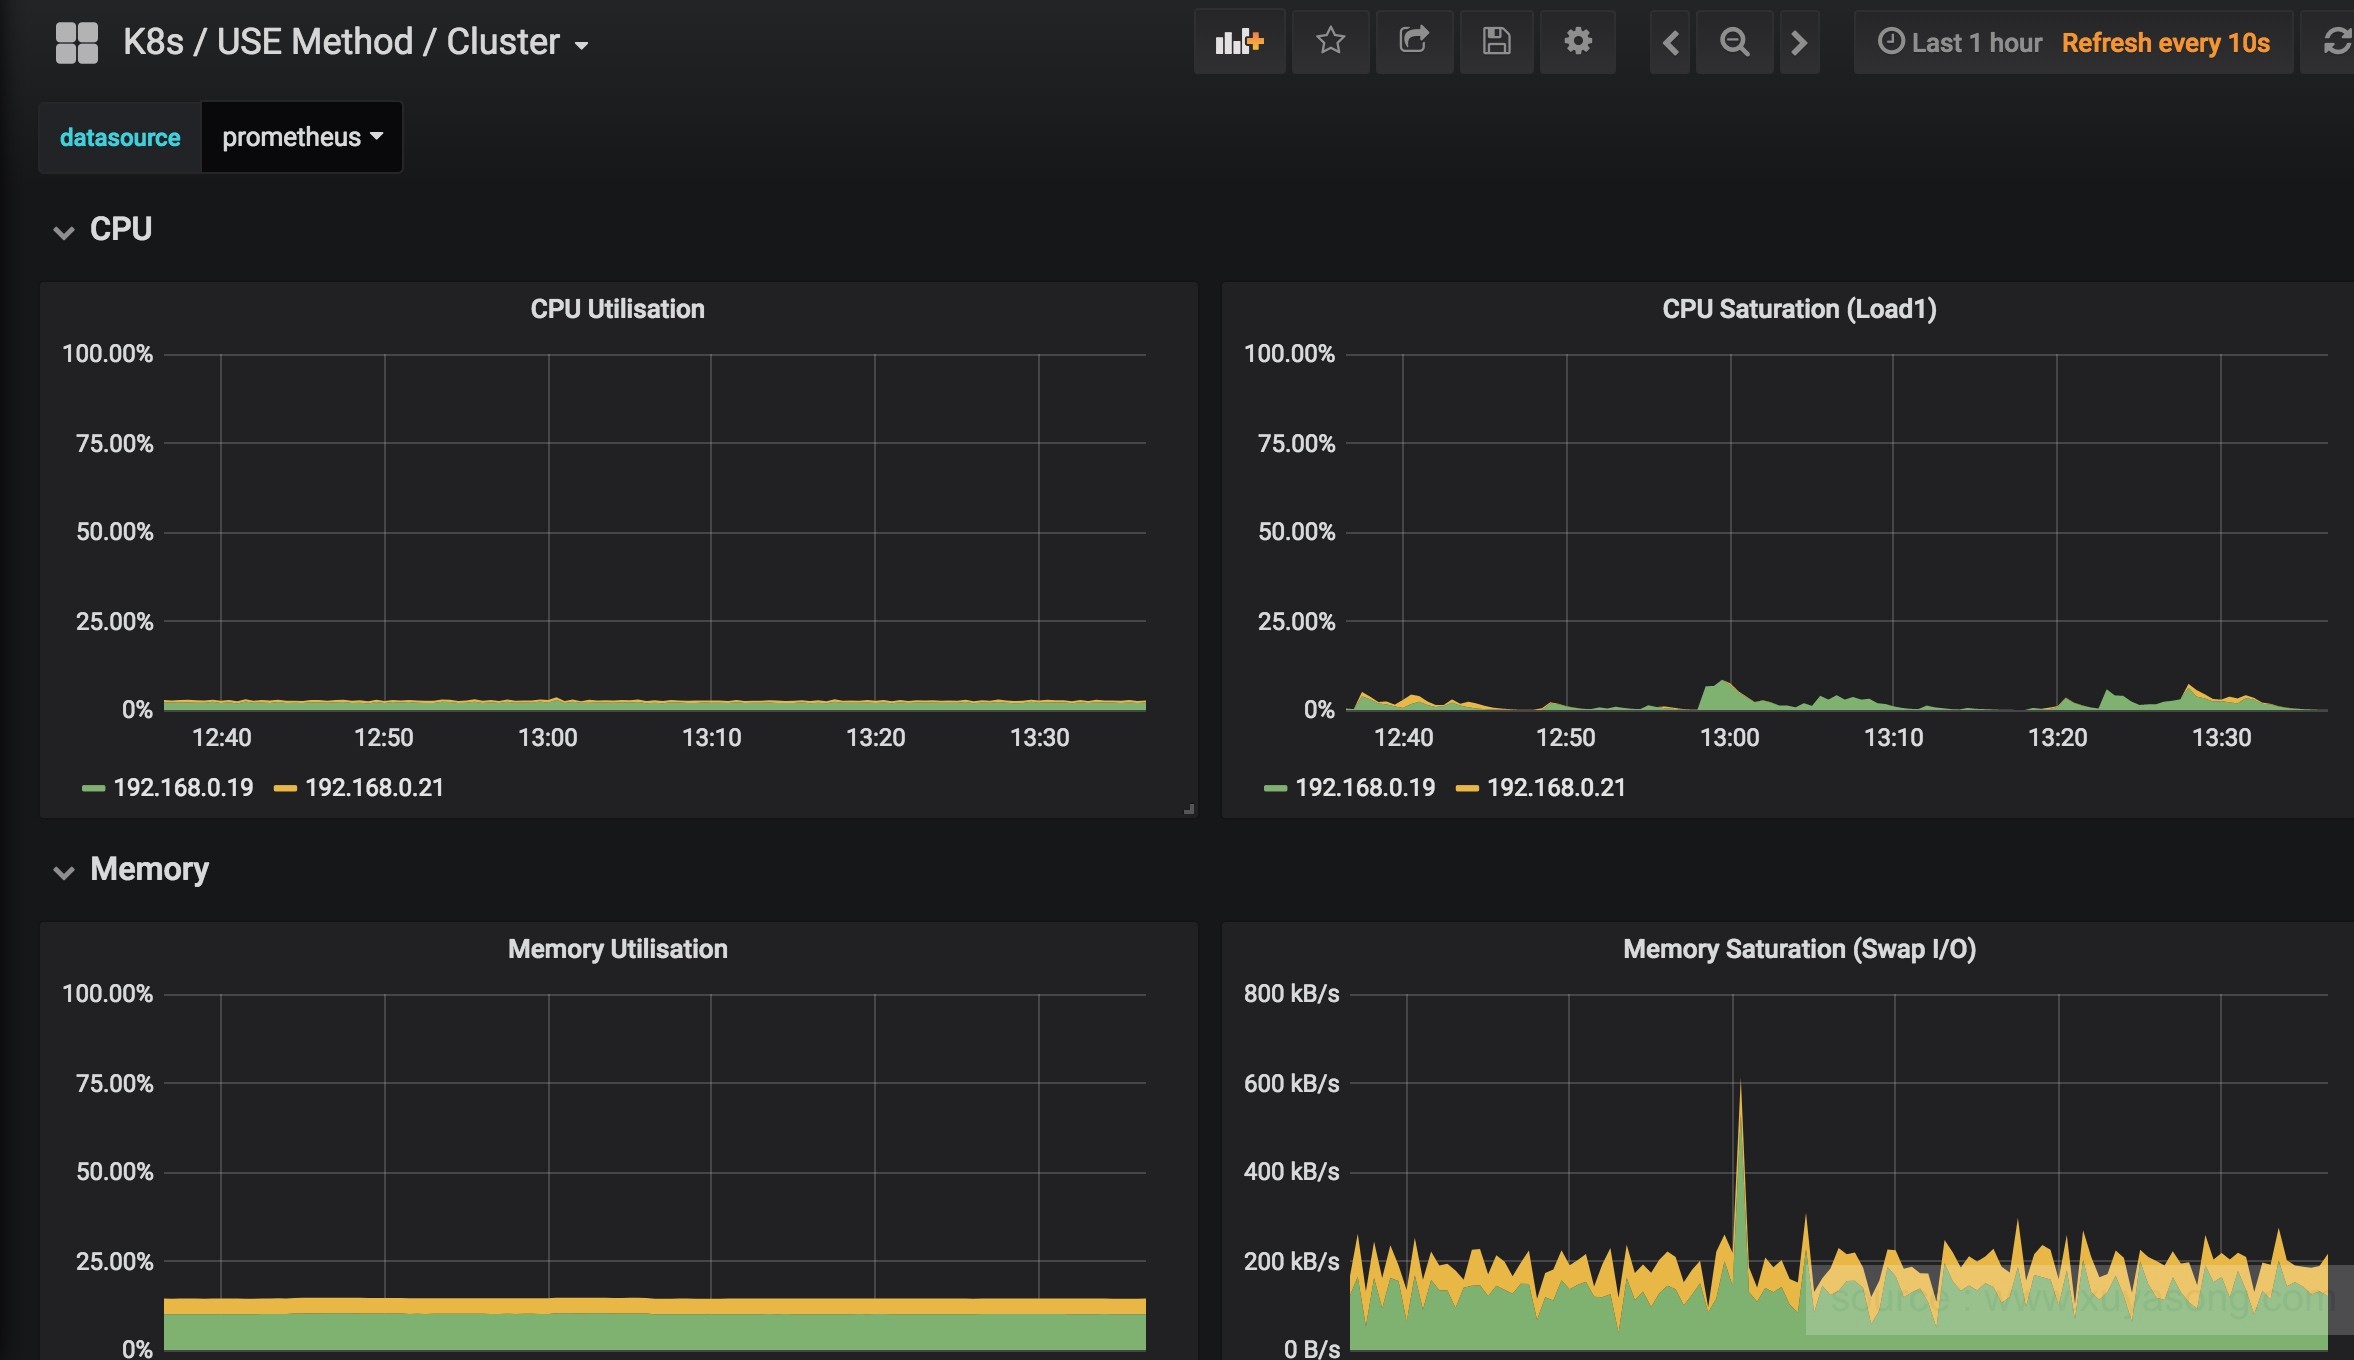
grafana的自带监控图列表:
常见问题:
因为要operator中要支持聚合api,在某些版本的集群上可能需要一些配置,如下:
* 安装cfssl证书生成工具:
* 生成证书
```
cfssl gencert -ca=/etc/kubernetes/pki/ca.pem -ca-key=/etc/kubernetes/pki/ca-key.pem -config=/etc/kubernetes/pki/ca-config.json -profile=jpaas metrics-server-csr.json | cfssljson -bare metrics-server
{
"CN": "aggregator",
"host": [],
"key": {
"algo": "rsa",
"size": 2048
},
"names": [
{
"C": "CN",
"ST": "BeiJing",
"L": "BeiJing",
"O": "k8s",
"OU": "cloudnative"
}
]
}
```
* 配置master组件参数,以支持metric-server
```
vim /etc/systemd/system/kube-apiserver.service
--requestheader-client-ca-file=/etc/kubernetes/pki/ca.pem \
--requestheader-allowed-names="aggregator" \
--requestheader-extra-headers-prefix="X-Remote-Extra-" \
--requestheader-group-headers=X-Remote-Group \
--requestheader-username-headers=X-Remote-User \
--proxy-client-cert-file=/etc/kubernetes/pki/metrics-server.pem \
--proxy-client-key-file=/etc/kubernetes/pki/metrics-server-key.pem \
--runtime-config=api/all=true \
--enable-aggregator-routing=true \
systemctl daemon-reload
systemctl restart kube-apiserver.service
systemctl status kube-apiserver.service
vim /etc/systemd/system/kube-controller.service
--horizontal-pod-autoscaler-use-rest-clients=true
systemctl daemon-reload
systemctl restart kube-controller.service
systemctl status kube-controller.service
```
* 启动成功后,prometheus的target中,kubelet没有值,401报错
```
vim /etc/systemd/system/kubelet.service
--authentication-token-webhook=true
--authorization-mode=Webhook
systemctl daemon-reload
systemctl restart kubelet.service
```
参考文档:
*
*
*
本文为容器监控实践系列文章,完整内容见:[container-monitor-book](https://yasongxu.gitbook.io/container-monitor/)